Main Window
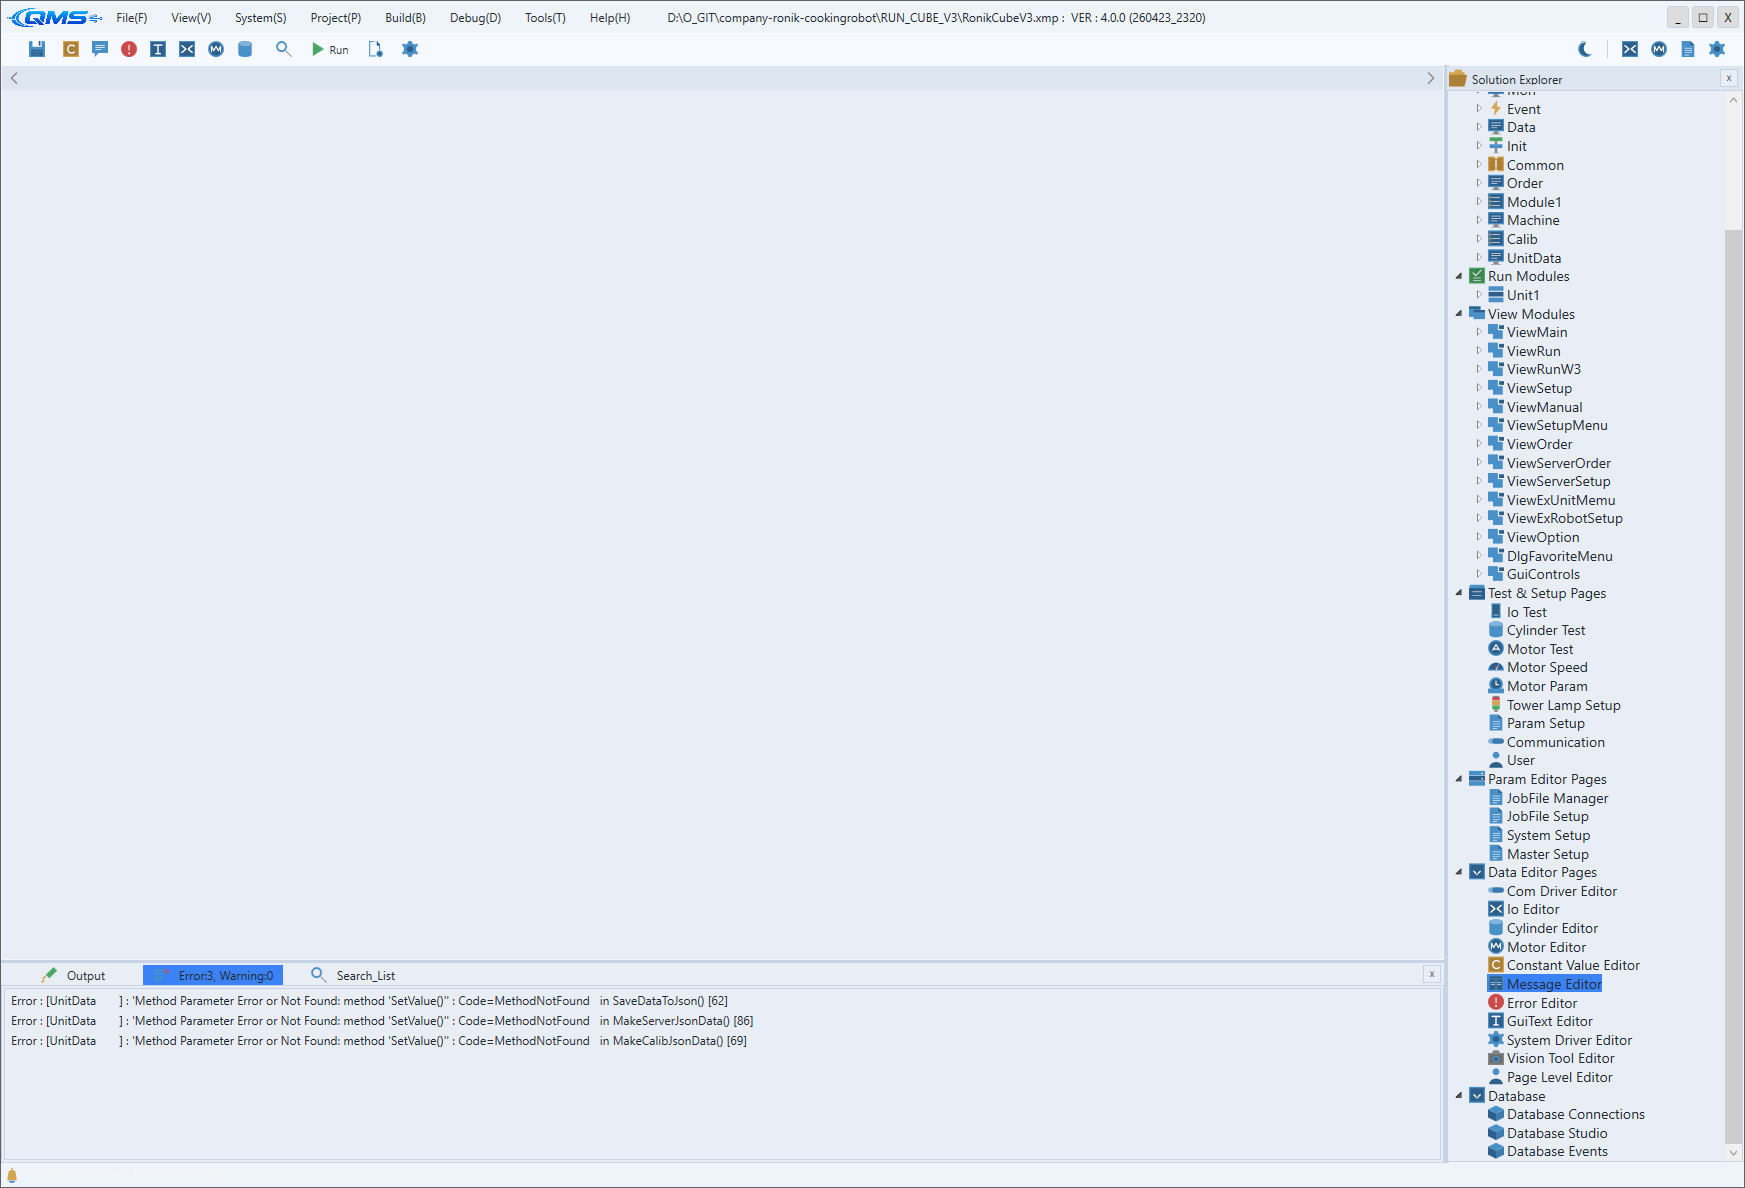
This is the IDE's base frame shown when you launch QMachineStudio. It consists of the title bar and toolbar at the top, the Solution Explorer on the side, a tab-based document editing area in the center, and the result panel at the bottom — letting you edit, build, diagnose, and run a project from a single screen.
From top to bottom the window is divided into four areas: title bar, toolbar, work area (center + right), and status bar. Each area is described in order below.
Title Bar and Menus
The title bar at the very top shows the app logo and the name of the currently open project, with minimize, maximize, and close buttons at the far right. Eight main menus are laid out horizontally next to the logo.
The eight menus are listed below. The individual items of each menu are covered in their own chapters.
| Menu | Role | Detail |
|---|---|---|
| File | Save, open/close project, Import/Export of multilingual/message/error data, Git | File Menu |
| View | Show the result panel and Solution Explorer | View Menu |
| System | Equipment setup, test, and diagnostic screens | System Menu |
| Project | Version info, editors, and project options | Project Menu |
| Build | Save All & Make, Rebuild, Run | Build Menu |
| Debug | Data Watcher, Task Monitor | Debug Menu |
| Tools | IO/Motor Monitor, license, Tool Options | Tools Menu |
| Help | Manuals, online docs, About | Help Menu |
The "Edit menu" referenced in earlier versions does not exist; the actual menus are only the eight above.
Toolbar
The toolbar below the title bar gathers frequently used commands as icon buttons. Editing and build buttons are on the left, while the theme toggle and monitoring dialog buttons are on the right.
The left-side buttons are:
Save All & Rebuild (Ctrl+S)— save all files and rebuildConstant Value Editor— global constant editor (Global Constant Editor)Message Editor— message editor (Message Editor)Error Editor— error definition editor (Error Editor)GUI Text Editor— GUI multilingual text editor (GUI Text Editor)IO Editor— I/O definition editor (IO Editor)Motor Editor— motor definition editor (Motor Editor)Cylinder Editor— cylinder definition editor (Cylinder Editor)Search (Ctrl+F)— project-wide searchRun Machine (F5)— start equipment runtimeProject Options— project options (Project Option)Tool Options— IDE environment settings
Next come the Lock Design toggle and the alignment buttons. Releasing Lock Design activates the
design editing mode, which reveals the alignment, sizing, and spacing buttons (Align, Make same size,
Space equally, etc.). The language buttons are ENG / KOR / CHN, and the adjacent
Apply Current Language To All button applies the currently selected language to every GUI control at
once.
The right-side buttons are:
- Light/Dark theme toggle — a horizontal slide switch that swaps the light and dark themes
IO Monitor— real-time I/O monitorMotor Monitor— real-time motor axis monitorJobFile Parameter Editor— edit JobFile parametersSetup Parameter Editor— edit Setup parameters
Central Document Editing Area
The center of the work area is a tab-based document editing area. Scripts, editors, and setup screens each open as tabs, and when there are many tabs you can move through them with the scroll buttons on either side of the header. A tab closes by double-clicking or via its close button.
Because many kinds of documents open in the same tab area, you can open an IO Editor or a setup screen alongside a script and work while comparing them.
Solution Explorer (Side Panel)
The Solution Explorer shows the project's components as a tree. It appears on the right of the work
area by default, and you toggle its visibility with View → View Solution Explorer (Ctrl+Shift+E).
Double-clicking a tree node opens that item in a center tab. You can drag and drop to reorder items or tidy up the structure.
Bottom Result Panel
At the bottom of the work area is the result panel that shows build and search results. It comprises
three tabs — Output, Error List, and Search_List — and is shown and focused with View →
View Result List (Ctrl+Shift+O). See Output / Error / Search Panel for
details.
Output— output messages from the build and run processError List— compile errors and warnings (double-click to jump to the location)Search_List— search results (one tab per query, up to 10)
Status Bar
The status bar at the very bottom shows the current status message. Together with the alert icon on the left, it briefly reports work progress or notices.