Debug Menu
The Debug menu provides watch tools for inspecting internal state while the equipment runs in runtime mode. Rather than writing code, these tools are used to observe the data and tasks of a running system in real time.
Click Debug on the top menu bar to open two watch windows. Both tools are normally used after starting the runtime with Run (F5).
Menu Items
Each item watches a different target. One shows data values, while the other shows the progress of concurrently running tasks.
| Item | Shortcut | Action |
|---|---|---|
Show Data Watcher | Ctrl + Alt + Shift + D | Watch global variables and device data in real time |
Show Task Monitor | Ctrl + Alt + Shift + T | Monitor the state of concurrent tasks such as sequences and steps |
Use Show Data Watcher to track values that change during runtime, and Show Task Monitor to see which sequence is at which step and how the flow proceeds.
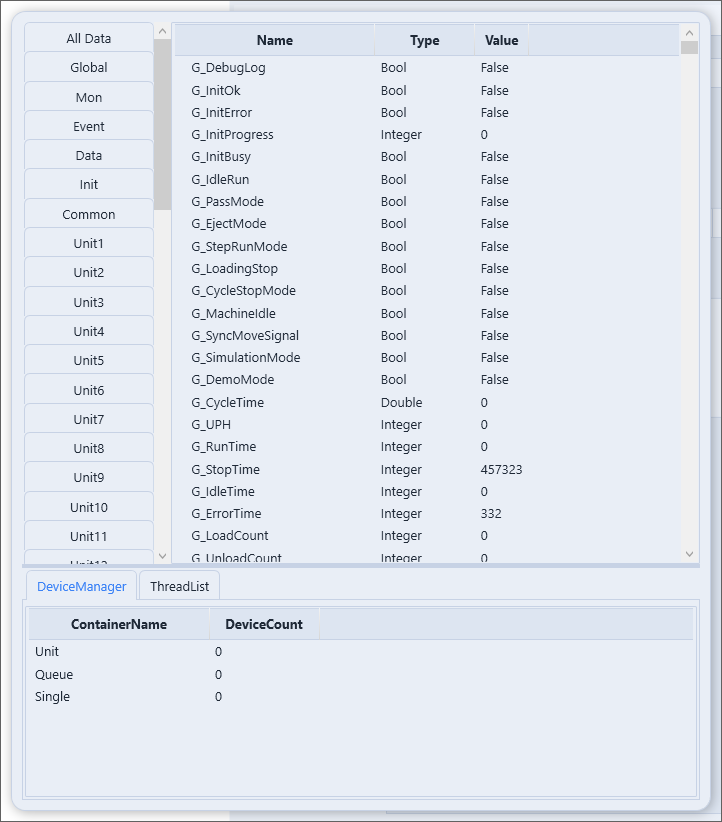
Data Watcher
Data Watcher is a window that shows the current values of global variables and device data in real time during runtime. Use it to track whether counters, flags, coordinates, and similar values update as intended.
It is useful for identifying where things go wrong when a value changes unexpectedly or fails to update.
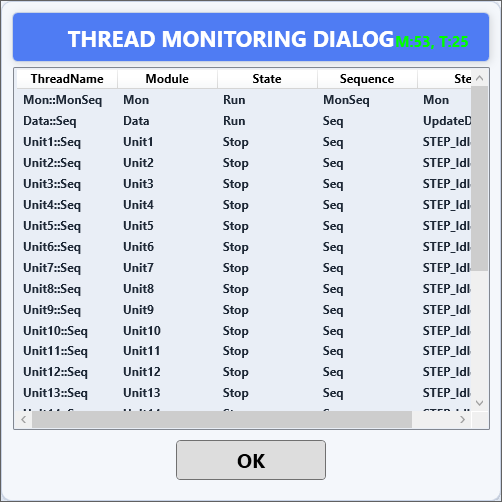
Task Monitor
Task Monitor is a window that shows, at a glance, the state of concurrently running tasks such as sequences and steps. You can see which stage each task is currently at and how it transitions.
On equipment where several sequences run in parallel, it helps narrow down the cause when a particular task is stalled or an expected transition does not occur.
Debugging Context
Both tools are meant to observe the behavior of a running system, not for static code analysis. The following order is therefore natural.
- Build with
F6and start the runtime withF5(Run). - Open
Show Data Watcherto keep key variable values visible. - Also view sequence progress with
Show Task Monitor. - Identify where a value or transition goes wrong, fix the script, then build and run again.
Checking the runtime output log in the Output panel at the same time speeds up finding the cause.